

How to Prepare Your Social Media Audit {FREE TOOL INCLUDED}
- Apr 29, 2018
- 10 min read
There are millions (if not billions) of people using social media every day.
If you’re not taking advantage of this traffic opportunity for your business or blog, you should be.
Once your social presence is set up and you’ve grown your followers, it’s important to run a social media audit on a regular basis.
With a social media audit, you can make sure that you are growing and creating content that targets your specific audience.
Do you know your demographics? Is your audience mostly men or women? What ages are they? What content gets the most interaction? What day and time is your audience most active?
In this tutorial, I will show you how to look at your social media analytics and record all of this data in one place!
Let’s get started!
How Often Should You Audit Your Social Media?
The frequency is completely up to you and the time you have available.
At the very least, you should run an audit quarterly. However, it would be best to audit your social media on a weekly basis.
Please note that the available analytics are different for each network. Some of them will not allow you to choose a custom time period, but others may only provide the last 28 days, 90 days, etc.
Most importantly, make sure that you stay consistent on when you conduct your audits.
Once your spreadsheet is set up, it won’t be difficult to record all of the data.
Social Media Audit Spreadsheet {Download Your Free Tool}
I’ve already put together a document for you to download for FREE. Whether you use Google Sheets or Microsoft Excel, you can grab your download below.
Click the button above and then use the image below to see how to save the file to your Google Drive.

Click to enlarge
Click the button above and then use the image below to see how to save the file to your OneDrive.

Click to enlarge
The great thing about both Google Sheets and Microsoft Excel is that you can easily share your file with team members or partners if needed.
Once you’ve downloaded your file, you notice a tab for each social network. Each tab is different depending on the analytics each network provides.
Feel free to add to or adapt the spreadsheet to meet your needs.
Facebook Audit
The first thing you can do on the Facebook tab is paste in the URL of your Facebook page.

Navigate to your Facebook page and scroll down to your followers. Record your current number of followers in the Followers column.

Next, click on Insights at the top of your page.This is where we’ll start gathering the rest of the data for our document

When you click on Insights, you should automatically see the Overview Page. The data defaults to the last 7 days, but you can change it to today, yesterday, or the last 28 days.

I’ve decided to run a weekly audit, so I’ve left mine at Last 7 days.
The first thing I’ll record on the spreadsheet is the date range the results are from.
Secondly, I will record the post engagements. Post Engagements are the number of times people engaged with your posts through likes, comments and shares. In my case, I had 8 total likes, comments, or shares.
Next, I’ll record the reach. Reach is the number of people who had any posts from your page enter their screen. If could have been the same person seeing your post multiple times. Or, it could have been that someone shared your post and their friends saw it in their news feeds. In my case, my posts were shown 27 times.

Your spreadsheet should now look something like this:

Next we’ll look at some demographics to see who your audience is. Click on People on the left sidebar of your Facebook Insights.

In this section, we’ll be able to see what gender and age group of people are most popular on on page. You can use this information to tailor your content to your audience.
You can even see where your followers are physically located and what language they speak, if that is relevant to your niche.
On my page, I can see that my followers are mostly women between the ages of 45 and 54.

Your spreadsheet should now look something like this:

Next, we’re going to look at what day and time your audience is on Facebook and what content is most popluar on your page. To see this data, click on the Posts link in the left sidebar.
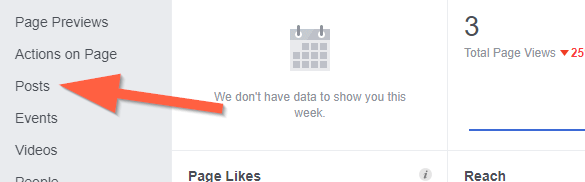
When you get to this page, you’ll see the days of week and the average hours of the day that your audience is most active.
Note that this data is only shown for the recent 1-week period.
My audience seems to be consistently on every day of the week. However, they are online usually around 6:00pm every day.
Be sure to record this information in your spreadsheet

Your spreadsheet should now look something like this:

You can get even more detailed on the hours of the day by hovering your cursor over one of the days of the week and the chart below will adjust to show you the hours specifically for that day.
See the example below:

Next you can click on Post Types at the top to see which performed best.
Once again, please note that this data is only shown for the recent 1-week period.
On the spreadsheet, there are columns for each of the posts types. Be sure to record the Average Reach, Post Clicks and Reactions, Comments, & Shares (abbreviated as R/C/S in the spreadsheet).
If you continue scrolling down you’ll see a list of all your posts. You can scroll through this list and see which posts had the most post reach and post engagement (likes, comments, shares). By clicking the dropdown box, you can choose Engagement Rate to get a better idea of what percentage of your reached audience is interacting with your posts.
Take note of what kind of posts these are so that you can create more similar content.
Make sure that you are posting things that your audience already enjoys!

Here is the finished result of my Facebook social media audit:
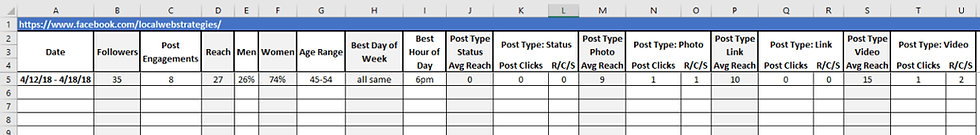
Click to enlarge
Pinterest Audit
Now that the Facebook Audit is done, we’ll move on to the Pinterest Tab. The first thing you’ll need to do is log into your interest account and navigate to your profile page.

Once you’re on your profile page, copy your Pinterest URL and paste it in the top of your spreadsheet. Then click on the Followers tab and you’ll see how many people are following you. Write this down on your spreadsheet in the followers column.

Next, well navigate to the Analytics portion of the site to start recording our data. You can do this by hovering your mouse over “Analytics” in the top left and clicking on Overview.

The first thing we’re going to look at is the number of people we reach with our pins. Click on the More button in the People you reach box.

We’ll start by changing the date range to 7 days since I’m doing a weekly audit. Be sure to record this date range on your spreadsheet in the Date column.

Then record the Avg. monthly viewers and Avg. monthly engaged data on your spreadsheet.
The average monthly views represent the average number of people who have seen your Pins over the past 30 days.
Average monthly engaged data is the average number of people who engaged (save, click, close-up) with your Pins each month.

Your spreadsheet should now look like this:

Now we can scroll down and gather some demographics information.
Understanding where your audience is from, what languages they speak and what gender they are can help you target your content better and find opportunities for your marketing and saving strategies.

Record the information that is important to your niche on your spreadsheet. Your social media audit should now look something like this.

Next, we’re going to grab the data for our audience’s interests. At the top of your screen, click on Interests.

Use the data on this page to see what topics your audience is interested in. This gives you a visual look at what your followers enjoy. Understand what your audience cares about and get new ideas for Pins and boards. These subjects can give you ideas for your content strategy, helping you connect and stay relevant with more people.
You can also see the boards that your audience is saving your pins to. You can see how your audience organizes your stuff and thinks about your brand. Use this to create new board categories for your own profile and marketing.

Your spreadsheet should now look like this:
Lastly, we’re going to check out our most popular pins to see which pins are performing the best. Navigate to the top left of your page, hover your mouse over Analytics and click on Website.

On this screen, be sure to change the dropdown box to the desired date range.
Now we will record the Avg. daily impressions on our spreadsheet. This is the number of times a Pin linked to your website has appeared on Pinterest homefeeds, category feeds and search.
A viewer is anyone who sees a Pin from your website on their feeds. You can also add this data to your spreadsheet if you want, but my main goal is to see the total number of times my pin was shown to Pinterest users.

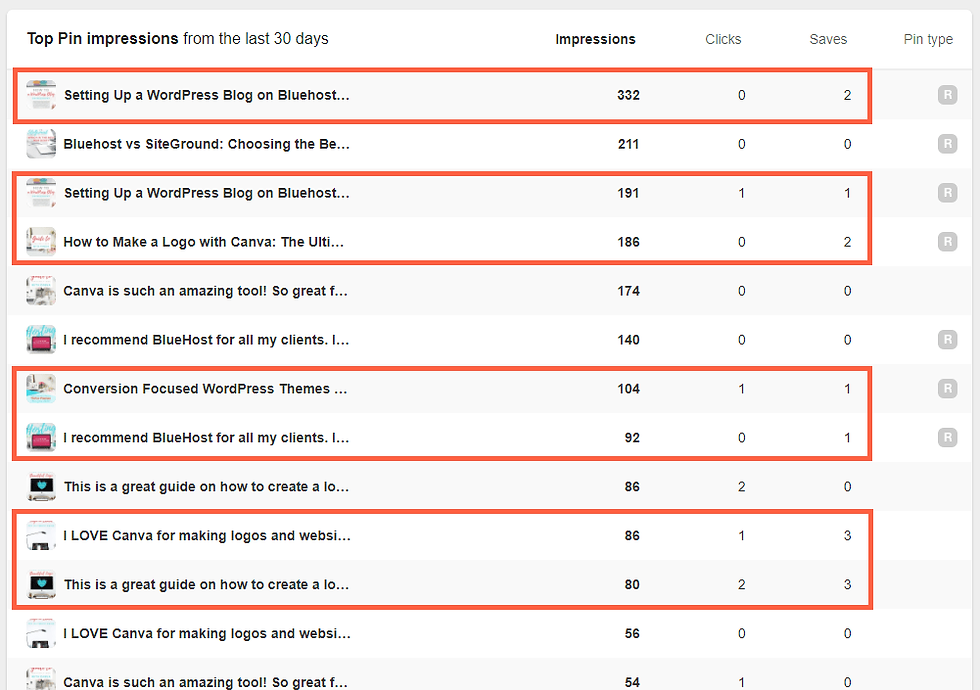
Scrolling down on this page you’ll see your Top pin impressions. I like to look for the pins that have the most shares as it shows that people thought my content was good enough to share with others.
With this information I will record on my spreadsheet that the Popular Content was pins regarding Canva and Bluehost.
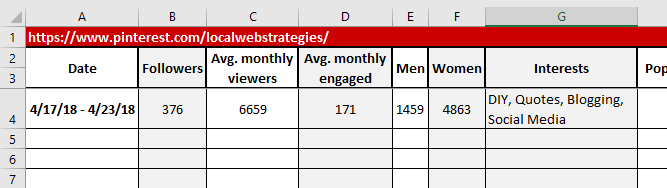
Here’s a snapshot of what your spreadsheet should look like:

Next, we’ll click on the Saves tab at the top of the screen to see how often someone saved a Pin on Pinterest that links to your website.

Lastly, we’ll check out the Clicks to see the number of times people clicked on a Pin to get to your website.

You should now have a completed Pinterest audit that looks like this:

Instagram Audit
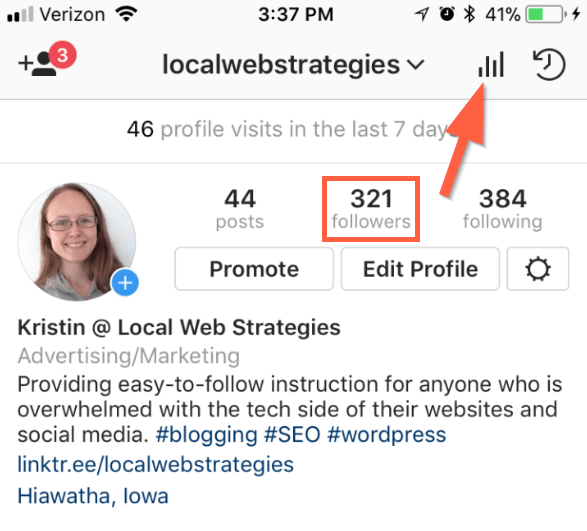
In order to start you Instagram audit, you’ll need to pull out your phone and navigate to your profile page. Be sure to record your followers in the Followers column of the spreadsheet.
Next, click on the Graph icon in the upper right to access the analytics.
On the analytics screen, scroll down until you see Discovery. At this time Instagram does not allow you to change the date range, so on your spreadsheet just record the time period they show on your screen.
Next, record the Reach and Impressions on your spreadsheet.
Reach represents the number of unique accounts that have seen any of your posts.
Impressions represent the total number of times all your posts were seen.
Some other pieces of data you may want to note is the number of profile visits and website clicks you received. This will be helpful to know if you are directing people to your website.

Your spreadsheet should look like this:

Next, we’ll gather some information on the demographics of your audience.
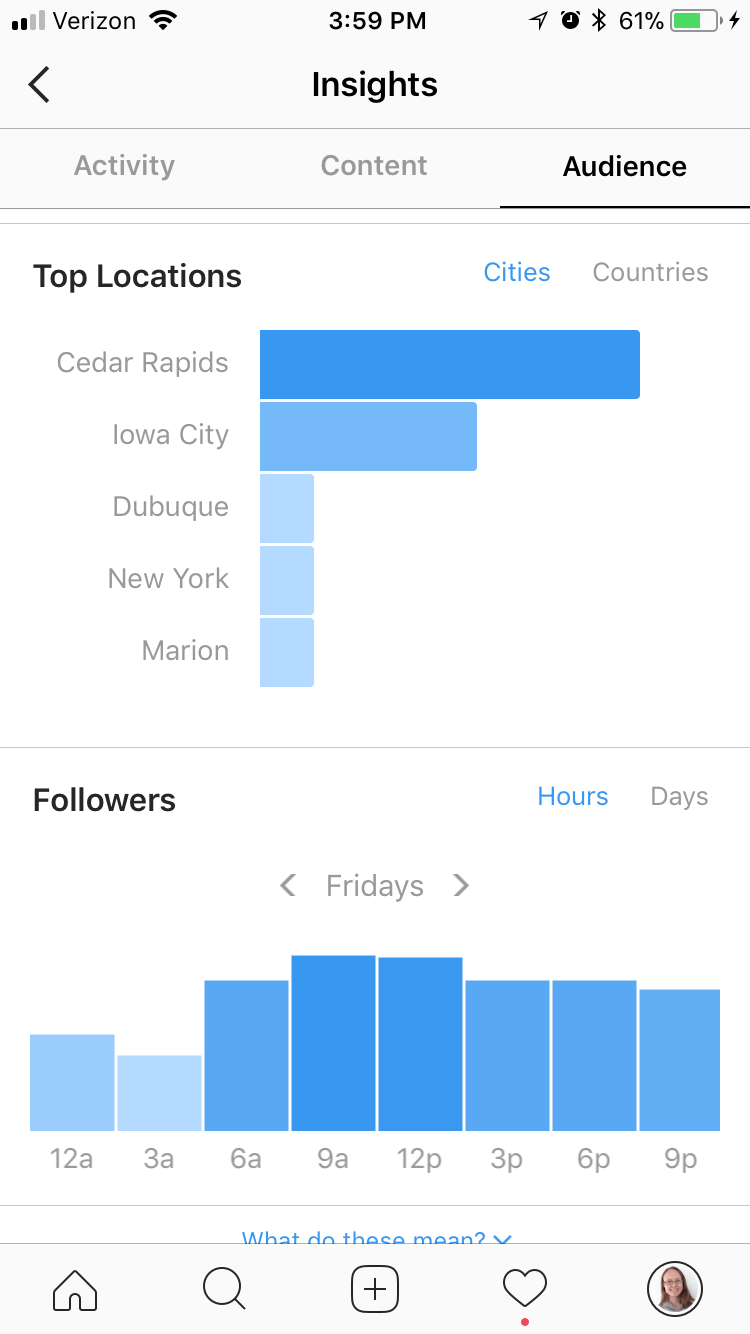
Scroll back to the top of your screen and click on Audience.

On this screen you’ll see all sorts of great demographic information. You’ll want to record the genders, age ranges, and even the days of week and hours that you followers are most active.

Your spreadsheet should now look something like this:

Lastly we’ll take a look at your most popular content to see what you audience like. Click on the Content tab at the top of your screen and then click the See all button.

Before we start collecting data, we need to change the time period and the metrics.
Click on the wording at the top of the screen and then move the scrolling bar to the metric and time period. I’ve chosen 7 days and I want to see engagement which tells me the number of times my posts were liked, saved, and commented on.
Then click on Apply.

Now I can see what was the most popular content in the last 7 days. In my case, motivational posts and pics referring to my blog content received the most engagement. Therefore I will add that to my Popular Content on my spreadsheet.
Your spreadsheet should now look something like this:

Twitter Audit
Now were ready to move on to Twitter. The first thing you’ll need to do is go to analytics.twitter.com and log into your account if you aren’t already.
You’ll see some initial stats that are based on the past 28 days. Make sure to record your number of followers on your spreadsheet.
Click on Tweets at the top of the screen.

Next, change the time period in the dropdown box to what you are doing your audit for. I am running a 7 day audit, so I selected 7 Days.
Click update to get the results.

The first thing we’ll look at and record is the impressions and engagement rate.
Impressions are the number of times your tweets were shown in the feed or search results.
Engagement rate is the number of engagements (clicks anywhere on the Tweet, including Retweets, replies, follows, likes, links, cards, hashtags, embedded media, username, profile photo, or Tweet expansion) divided by impressions.

Your spreadsheet should look something like this:

Before moving on to Demographics, we’re going to stay on the same screen and check out the popular content. Scroll down and click on Top Tweets. This will show you which of your tweets in the last 7 days had the most impressions and engagement.
In my case, I see the my tweet asking a question was popular as well as my on-the-fly post about Bluehost tech-support (this post also included a GIF would might have also helped).
After that my blog post links where the highest ranking.

Lastly, we check out the demographics of our audience. You can find this information by clicking Audiences in the upper left.
Once you get to this page, you’ll see the general interests on the left and the gender percentages on the right. Make sure to record this data in your spreadsheet.

You can also click on the Demographics tab to see more information about the language and location of your audience.

Make sure that you fill in all this data on your spreadsheet. It should look something like this:

YouTube Audit
Disclaimer: Since my YouTube channel doesn’t have much going on, I’ll be showing the analytics of another channel that I run. 🙂
The first thing you’ll need to do is navigate to your channel dashboard and record your total number of subscribers in your spreadsheet. Then click on Analytics.
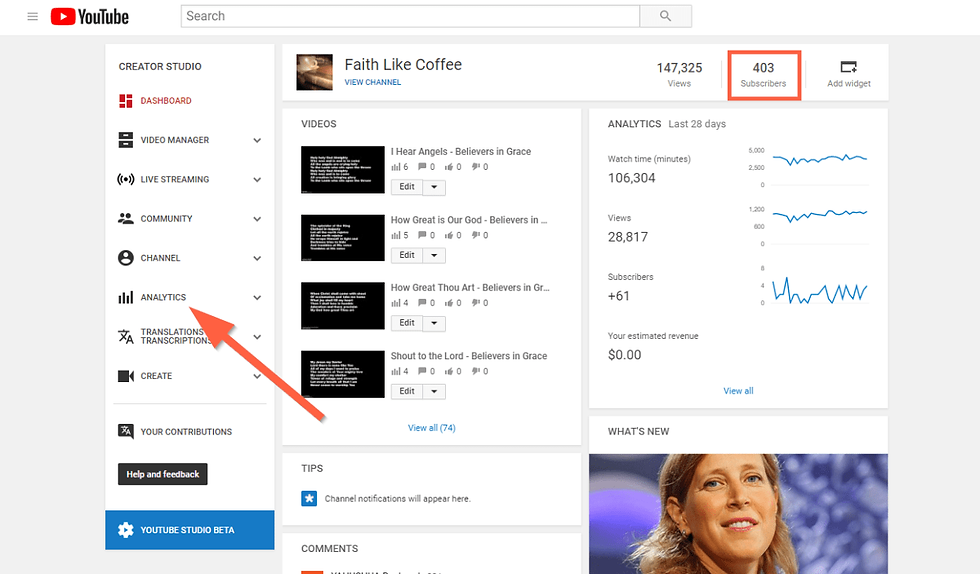
Click on the dropdown box in the upper right and select the time period your would like. Once again, I’ve chosen 7 days and have recorded those dates in my spreadsheet.

Next, record your watch time and views on your spreadsheet.
Watch time is the estimated total minutes of viewing time of your content from your audience.
Views are simply that… total views for your videos in the selected date range.
Also, if you monetize your channel, you may also want to record your earnings. For those currently not monetizing, this is a great way to earn extra income on your content. However, in early 2018 YouTube put new restrictions in place for who is eligible for monetization.
You channel must have 4,000 hours of watch time within the past 12 months and 1,000 subscribers.

Your spreadsheet should look something like this:

Next, we’ll look at the demographics of your audience. Click on the Demographics tab on the left.

On this screen you’ll see the gender and age demographics that you’ll want to record on your spreadsheet.

Your spreadsheet should look like this:

To find out the most popular content, we’re going to check out the Watch time page to see which exact videos we’re watched the most in our selected time period.
Click on Watch time on the left sidebar.

If you scroll down on the watch time page, you can group the videos that are similar as well as notice anything unique that attracted your viewers to those videos.

Your finished YouTube audit spreadsheet should look something like this:

Finishing Up Your Social Media Audit
Now that you’ve set up your spreadsheet and collected all the data, you can compare the different networks.
Find out what works best on each network and tailor your content to meet that audience.
Be sure to consistently update your spreadsheet so that you can also compare your data over time.


Comments